News
IEC publishes technical specification for grid frequency measurement (IEC TS 62786-41:2023)
The IEC (International Electrotechnical Commission) published the Technical Specification (TS) "IEEC TS 62786-41:2023 - Distributed energy resources connection with the grid - Part 41: Requirements for frequency measurement used to control distributed energy resources (DER) and loads" on July 17, 2023. For the first time, it sets minimum requirements for the measurement of grid frequency and ROCOF (Rate Of Change Of Frequency) for various application scenarios, as well as testing methods for classifying measuring devices in terms of these requirements.
In physics and technology, frequency is used as a measure for a periodic process such as an ongoing oscillation. The frequency is the reciprocal of the period. However, if one looks at the course of the grid voltage in an electricity grid, one recognizes besides the basic frequency many other components such as harmonic overtones, subharmonic waves, phase jumps as well as voltage fluctuations, which are generated by the multitude of connected feeders and consumers. Thus, the grid frequency is not a frequency in the physical sense, but a sum of various rotating vectors. This must be taken into account especially in dynamic processes in the power grid to avoid false measurement results.
The disconnection of 1.2 GW of photovoltaics on August 16, 2016 in California serves as a prime example of a very simple implementation of frequency measurement. Because of wildfires, a transmission line was preemptively shut down. This caused a phase jump on the remaining lines. The internal frequency measurement of several thousand PV inverters misinterpreted this as a short frequency drop from 60 Hz to below 57 Hz, causing the inverter control to initiate grid disconnection due to underfrequency. As a result, 1.2 GW of PV was disconnected from the grid within a few milliseconds. The power grid was able to handle this incident without a blackout, but with an increasing number of systems with simple frequency calculation, the power disconnected in the event of a disturbance increases.
The technical specification IEC TS 62786-41:2023 applies to systems for controlling distributed energy resources (DER) and electrical loads. Measurements for e.g., protection functions and relays are not covered by this specification. These measurements are already covered by other IEC standards, such as IEC 60255 118 1 and IEC 60255-181. A TS is often a precursor to an international standard (IS) and is therefore not mandatory, but should be seen as a guideline.
Further information can be found in the lecture by Allen Goldstein. The specification is available in the IEC webshop.
03.08.2023
EPEX SPOT expands intraday auctions
EEX Spot has introduced new local lintraday auctions in Austria, Belgium, France and the Netherlands on October 14, 2020. In Austria, Belgium and the Netherlands 15-minute contracts are now tradable, in France 30-minute contracts.
Link to EPEX SPOT with 15-Minute contracts
21.10.2020
Mains frequency meters go on sale
To grasp the degrees of freedom in the provision of primary control power use (Source) presented by the four German TSOs, an accuracy of ±1 mHz is an advantage over the previously required ±10 mHz, since the difference between permissible measurement uncertainty and measurement uncertainty of the device, can be used for example for a charging management of battery storage.
Therefore, the instruments used for the frequency measurement were developed
from the initial prototypes for scientific analysis to a product. The meters are now
available in a simple version and a version with time synchronization via GPS.
The accuracy is better than ±1 mHz, the resolution is 0.1 mHz.
→ For more informatino see frequency meters.
22.01.2015
Retrofit of dispersed generation planned
The ENTSO-E member countries should establish a plan until the end of 2015 to retrofit the dispersed generation to enhance the tolerance band in distributed energy systems such as wind and PV systems to 47.5 Hz to 51.5 Hz.
The ENTSO-E has published a position paper in November 2014 (DISPERSED GENERATION IMPACT ON CONTINENTAL EUROPE REGION SECURITY). Herein is described that at the advent of the first dispersed generation with respect to the mains frequency only tight shut-off criteria were set to obtain as quickly as possible defined conditions when a fault in the network occurs. The following strong expansion of dispersed generation now leads to some problems, which can be solved through expanding the frequency band significantly - to 47.5 Hz to 51.5 Hz.
19.01.2015
Minimum and maximum mains frequency
To clarify the question "how stable is the mains frequency", data of the last 13 months was analyzed (July 2011 to July 2012). The greatest fluctuations occurred regularly on the hour change, which is caused by the use of products of hours. The limits of frequency range allowed in normal operation (49.8 Hz to 50.2 Hz) were never reached or exceeded in this period:
 * Maximum frequency: 50,164 Hz on tuesday, 13.12.2011, 23:52:54
 * Minimum frequency: 49,849 Hz on tuesday, 17.01.2012, 23:02:08
The following figure shows the frequency response (average of seconds) for several hours before and after.
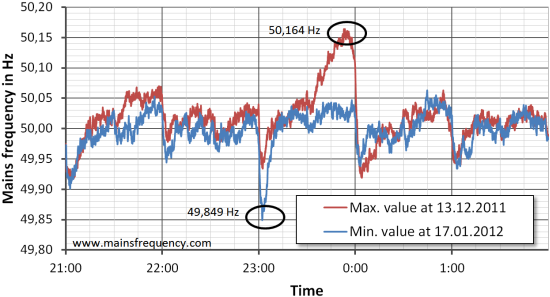
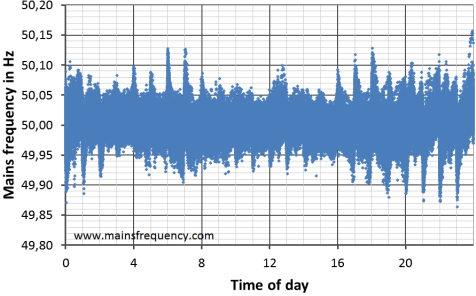
Both the highest and the lowest value occurred in the late night. To see this more clearly, the measured values (average of minutes) were put in a scatter plot. It is shown that frequencies below 49.90 Hz occur only at night. In the time between the change of hours reveals a band of frequency deviation of about ±60 mHz, which results from forecast errors and unexpected changes in the supply or the load. On hour change significantly higher deviations can be seen.
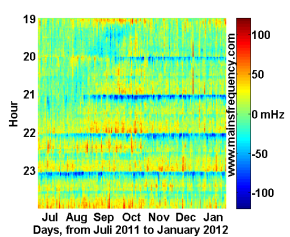
06.09.2012
Carpetplots of the frequency deviation
Forecast errors are caused by unexpected consumer behavior, power outages and loss or reduced supply by
conventional and renewable power plants. If the forecast errors in consumption and production would occur
randomly, then the analysis of the frequency deviations from 50.0 Hz would show a steady noise.
Instead, the Carpet plot
shows systematic frequency variations on the hour change. The greater the
change in load, the greater the deviation.
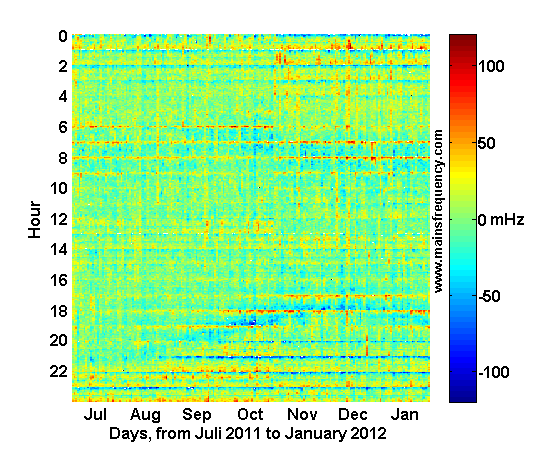
This effect is caused by the systematic error between the 15-minute schedule of the power consumption forecast and the purchased hour-blocks from the EEX. When the load increases (eg in the morning) then the purchased power generation does not increase continuously, it increases each hour. This activating of power results to over-supply, so the mains frequency increases for a short time, until the secondary control power decreases it. This can be observed vice versa in the load reduction of the late evening.
Because of the inertia of the thermal power plants, they are allowed to drive the load changes as a ramp within 15 minutes. The frequency deviation shows that the ramps are driven much faster. The duration of the ramp can not be accurately determined because the onset of the secondary control power, apparently, the power is activated or withdrawn within about 4 minutes.
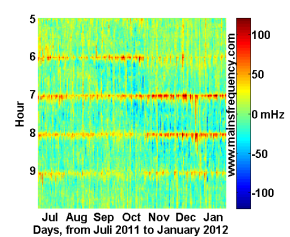
The left image shows the frequency deviation in the early morning hours (5 am to 10 am), the
right image shows the evening (19pm to midnight). The images show the opposite
view of the frequency deviations according to the morning load increase and load reduction of the late evening.
This systematic frequency error within the hour change frequently allocates over 50 % of the primary control power, during this time is no longer available to offset other errors. The effect is substantially weakened only when the majority of the electricity traders balance their balancing group in the newly created market for 15-minute products.
10.02.2012
EEX starts trading 15-Minute Contracts
EEX SPOT startet trading 15-Minute Contracts on 14 December 2011 (press release). This should help to avoid the frequency-deviations generated by the hourly trading and make it easier to integrate the influx of renewable energy, which is seldom constant for an hour.
21.12.2011
Please visit the german news: Aktuelles zur Netzfrequenz